Self assessment for group presentation: week 11, group 1, Latin American music
Content & organization:
Each of us took a different approach to our sections – I spoke about one style of music only, as I felt the time limit only allowed me to look at one with reasonable depth, while Una covered the general history of Puerto Rico more and Jemma spoke about influences on Mexican music. In terms of bringing in our backgrounds, I spoke on how the media helped spread the tango and Jemma spoke about music was taught in Mexican schools. In retrospect we could have focused on the international dimensions of the music more. - satisfactory 5/8
Audiovisual media/other presentation material:
I was in charge of the powerpoint (the other girls emailed me their information) so that at least it looked like one presentation instead of three separate ones. I tried to play visually with the powerpoint, to put in meaningful and evocative images and keep the information as a summary, as the powerpoint was meant to visually enhance our presentation but not distract from it. I didn’t want people to only read the presentation and not listen to us. We also tried to do something different and put in videos, both from Youtube and our own videos. We thought this would be more exciting than merely images; unfortunately our video interview didn’t work on the day, despite rigorous testing previously in other classrooms - good 7/8
Presentation skills:
I was a bit loud and casual in my tone, but I think Una and Jemma did a great job of speaking to the class instead of speaking at them. Some speakers speak at the class and drone on with minimal engagement or without any thought of their audience but we maintained a good volume and a good pace - good 6/8
Contributions of members:
Each member was given tasks and we all fulfilled these. I did the powerpoint while Una wrote the introduction and Jemma edited the video on top of our presentations. - good 3/3
Friday, May 22, 2009
Thursday, May 21, 2009
Peer assessment #2
Peer assessment for group presentation: week 9, group 1, sport
Am publishing this a bit late...
Content & organization:
There was plenty of information and it was clear this group had done their research, however since the presentation required us to “explore the international dimensions” (which I guess is pretty open to interpretation, but still) I feel that the information wasn’t entirely relevant. Jay, for example, basically gave the history of cricket and while this was interesting and the point was to demonstrate the multicultural aspects of the sport, it just seemed like a history of cricket in India and a history of cricket in Australia. The other presenters had a similar problem - satisfactory 5/8
Audiovisual media/other presentation material:
The groups used a powerpoint presentation with photos, which wasn’t particularly exciting, but it was simple and effective without being boring. The photos were great, they either illustrated the presenter’s points beautifully or provided extra information. Sometimes presenters underestimate the power of selecting the right images, but this group did well - good 7/8
Presentation skills:
While their presenting skills weren’t noticeably bad, they weren’t exceptional either. The second presenter was a bit quiet, but other than that the presenters did well and showed no sign of nervousness, even though afterwards they all admitted they had been extremely nervous - good 6/8
Contributions of members:
Each member was equally involved, presented for the same amount of time and none seemed to dominate. Overall quality was consistent, demonstrating good team co-operation - good 3/3
Wednesday, May 20, 2009
Peer assessment #1
Peer assessment for group presentation: week 11, group 2, Puerto Rico
Content and organization
Individually, the first two presenters deserved a good mark as their presenatations were well-researched, logical and provided in-depth information about Puerto Rico, covering a range of topics from music and religion to history and language. But the last presenter was all over the place, and only repeated what the first two said. So overall, it would probably average out as satisfactory – satisfactory 5/8
Audiovisual Media/Other presentation material
Good – like most groups, they used a powerpoint presentation and their slides summarised and illustrated what they were saying quite well. THe only problem was that their slides weren’t timed very well. Only a few sentences accompanied a slide and there was no time for the audience to absorb what was on the slide – good 6/8
Presentation skills
Good vocal skills but quite fast and the presentation had too many statistics in an already overly informative speech, so audience engagement was not very high. Again, the group was let down by the last presenter, whose lack of preparation showed in her lack of confidence and it was really quite painful to watch – satisfactory 4/8
Contributions of members
It didn’t seem so much that two members dominated as the last member didn’t put in the same amount of work, time and preparation as the other two and this really let down the group. It almost seemed like she didn’t even look at her presentation before the date – unsatisfactory 0/3
Monday, May 18, 2009
Week 11: the Americas
The lecture last week proved to be the most helpful of all lectures so far, as it covered the Americas and the US-Mexican border and this week, in Spanish 3, I’m doing a presentation on crossing the border. So it’s a good thing that each topic has a different focus country. Anyway.
Ideas I found interesting:
- State borders are not essential or timeless, they are constantly changing.
- The effects of a border extend beyond the borderlands.
- Latinos are marginal to the imagined community and are considered “outsiders”, yet Latinos were the original inhabitants of much of the US
- Aztlán – a nation that’s neither the US nor Mexico
Mexicans refer to the border as 'La Linea' - the line. And that's all it really is - a line that the US and Mexican governments decided on, despite the fact that it clearly divided communities. Which is another consideration - is the imagined nation stronger than the physical nation?
Just keep on pushing: over the borderline

This was taken on the Mexico side of the border wall between Mexico and the USA, at the beach where the wall extends far enough into the tide so that any attempt to swim around it would be fatal. The barrier itself is actually easily crossed, but border patrol is thick on the USA side.
Image: GuzVenom via deviatnart.com
Text: ~calistardust via deviantart.com
Sunday, May 17, 2009
Week 10: War
Sometimes it’s good to look at the bigger picture. In terms of war, though, sometimes we spend too much time thinking about this bigger picture and we forget the smaller picture – that yes, this affects people on a daily basis. So while the lecture didn’t cover the Iraq war, because it’s the most prominent current war in most Australians’ minds, I thought it would be interesting to examine the statistics and look at this aspect of war:
U.S. SPENDING IN IRAQ
• Amount of money spent and approved for war in the US - About $800 billion of US taxpayers' funds spent or approved for spending through mid-2009. In April 2009, President Obama announced that he will seek an additional $76 billion for the wars in Iraq and Afghanistan.
• U.S. monthly spending in Iraq - $12 billion in 2008
• U.S. spending per second - $5,000 in 2008
TROOPS IN IRAQ
• Troops in Iraq - Total 140,000, including 135,000 from the US, 4,000 from the UK, and 1,000 from all other nations
• Troop casualties - 4, 594
• US troops with serious mental health problems - 30% of US troops develop serious mental health problems within three to four months of returning home
IRAQI TROOPS, CIVILIANS & OTHERS IN IRAQ
• Journalists killed - 138, 92 by murder, 46 by acts of war (as a journalism student I thought this was interesting)
• Estimated number of Iraqi civilians killed - A UN issued report dated Sept 20, 2006 stating that Iraqi civilian casualties have been significantly under-reported. Casualties are reported at 50,000 to over 100,000, but may be much higher. Some informed estimates place Iraqi civilian casualities at over 600,000.
QUALITY OF LIFE INDICATORS
I created the image below to help me visualise the following statistics in relation to each other, as opposed to just being numbers on a page.
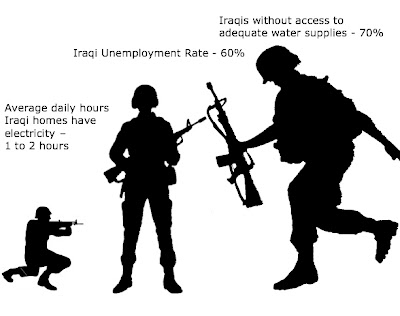
• Iraqi unemployment rate – 27% to 60%, where curfew not in effect
• Percent of professionals who have left Iraq since 2003 - 40%
• Average daily hours Iraqi homes have electricity - 1 to 2 hours
• Iraqis without access to adequate water supplies - 70%
http://usliberals.about.com/od/homelandsecurit1/a/IraqNumbers.htm
Monday, May 4, 2009
Week 9: Food and globalization
So basically last week’s lecture was on food security, which is having access to healthy food (not just any food. So if you had access toan endless supply of McDonald’s, but nothing else, then you don’t have food security).
It was something I’d never even considered until about two weeks ago. Food security is something I take for granted, but then I found out that actually, quite a lot of people in Sydney don’t have food security. This was mind-boggling to me – we live in a first world country, for goodness’ sake. This isn’t something that happens to people overseas in countries we’ve never been to, let alone heard of (hey, some of those Central African countries are really quite obscure), but something that happens to fellow Sydneysiders. Chew on THAT. (Food pun #1)
Food security facts, taken from a survey of households in Warwick Farm, Villawood and Rosemeadow/Ambarvale in Sydney’s South-West:
• 21.9% of households have experienced food insecurity
• 30% of households with children were food insecure
• 45% of single parent households were food insecure.
Food for thought from the lecture (food pun #2):
• Australians throw 3.3million tonnes of food away a year.
• In an attempt to increase food yield, large quantities of fertilizer are used.
• Technology has resulted in the destruction of traditional food systems and subsistence agriculture.
It touches on with the theme from week 7: sustainable development. How can we keep up with the increasing demands of the population without creating more long-term problems? Beatriz spoke about the fact that at the moment, food security in Chian is not as big a problem as was previously expected, because many people in China actually grow their own food. But as China urbanizes and more people move to the city, how will China be able to keep up its food production? Can the world develop technologically and still satisfy that most basic of human needs, the need for food?

Photo: ~Philip-Scammell via deviantART
Subscribe to:
Posts (Atom)